Infographic template
Create a five-step process infographic
Turn a sequence of steps into a clean horizontal infographic with numbered nodes, icons, and arrows that read left to right.
Make this with my informationOpens an editable creation brief. Nothing runs until you submit.
- Format
- Infographic
- Last updated
- September 17, 2026
- You bring
- 3 inputs
- By
- Huggle Editorial

The creation brief
This template is for product and marketing teams explaining how something works — onboarding, a workflow, a service. Huggle lays out the steps and icons; you supply the sequence.
Creation recipe
Create a clean horizontal infographic showing a 5-step customer onboarding process. Five numbered circles in a row connected by short arrows, each with a simple flat icon inside: sign up, set up profile, connect data, invite team, launch. Minimal flat style, soft pastel accent colors on a light background, generous spacing, no more than two words of label under each step. No decorative clutter, no photos.
What Huggle creates
- A left-to-right process diagram with numbered nodes and icons
- Consistent flat iconography in one accent palette
- Short labels that stay legible when the image is shared
What to bring
- 01The steps, in order, with a two-word label each
- 02Brand colors for the accents, or keep the pastel default
- 03Where it will be used: slide, blog, social, or docs
Overview
What is a process infographic?
A process infographic shows a sequence of steps as a single picture: numbered nodes, an icon for each stage, and arrows that carry the eye from start to finish. It replaces a paragraph of explanation in a slide, a how-it-works section, or a social post, and it works because people can see the shape of the process before reading any of it.
What's included
What this AI infographic generator produces
Numbered nodes and arrows
Five circles in a row, connected by short arrows, reading left to right. Give Huggle your steps in order and the layout adapts to four or six without crowding.
Flat icons per step
One simple icon inside each node — a profile, a plug, a rocket. The prompt asks for a consistent flat style so the icons look like a set rather than a search result.
Restrained labels
Two words under each step, no more. Generated text is fragile, and short labels are what keep infographics readable when shared at thumbnail size. Put the detail in the surrounding copy.
Palette and format
Soft pastel accents on a light background by default; switch to your brand colors or a dark theme in one sentence. Wide format suits slides and blog posts; ask for a vertical stack for Stories.
Comparison
Huggle vs. an infographic template
Infographic templates give you boxes to fill and icons to hunt for. This prompt renders the whole diagram from your steps.
| Criterion | Huggle | Static template |
|---|---|---|
| Starting point | A finished diagram of your steps with matching icons | A layout with lorem ipsum and placeholder icons |
| Icons | Generated as a consistent set | Sourced one by one from an icon library |
| Changing the step count | Ask for four or six steps | Rebuild the layout |
| Where it lives | Next to the deck or document it explains | In a separate design tool |
Sources
Sources and benchmarks
- MIT neuroscientists found that the human brain can identify an image seen for as little as 13 milliseconds, which is roughly how long a graphic gets before someone decides whether to stop scrolling. MIT News, “In the blink of an eye”
How it works
From example to your finished artifact
- 01
Start from the proven recipe
Open Huggle with the complete creation brief already in the composer.
- 02
Add your context
Answer a few focused questions so the subject, copy, and visual direction fit your situation.
- 03
Create and refine
Generate the media, then ask Huggle for a different crop, palette, hook, or another take until it is ready to use.
Use the recipe
Make a version that belongs to your work.
Huggle will ask for the missing context, then create an editable image you can keep refining.
Frequently asked questions
- What is an AI infographic generator?
- It turns a list of steps into a designed diagram. Huggle lays out nodes, icons, arrows, and labels from this prompt and revises when you ask.
- How many steps can the infographic show?
- Three to seven works in a single row. Beyond that, ask for two rows or a vertical layout.
- Can I use my brand colors?
- Yes. Name your accent colors and whether the background should be light or dark. The structure stays the same.
- Will the labels be spelled correctly?
- Short labels are the most reliable, which is why the prompt caps them at two words. Check them before publishing, and put longer copy in the surrounding text.
- Can I use the infographic in a slide deck?
- Yes. The wide format fits a 16:9 slide. Pair it with the slides templates to build the rest of the deck.
- Is the image editable after generation?
- Yes. Ask Huggle to change an icon, reorder steps, switch the palette, or produce a vertical version for social.
- What information do I need to bring?
- Bring the steps in order with a short label for each, your accent colors if any, and where the infographic will be used.
- How do I use this infographic template?
- Open Huggle with the prompt in the composer, replace the onboarding steps with yours, and generate. Then ask for the formats you need.
Related templates
3 artifacts
Thumbnail
YouTube thumbnail
Generate a 16:9 thumbnail with a clear split composition, a bold three-to-five-word promise, and contrast that survives a phone screen.
Open template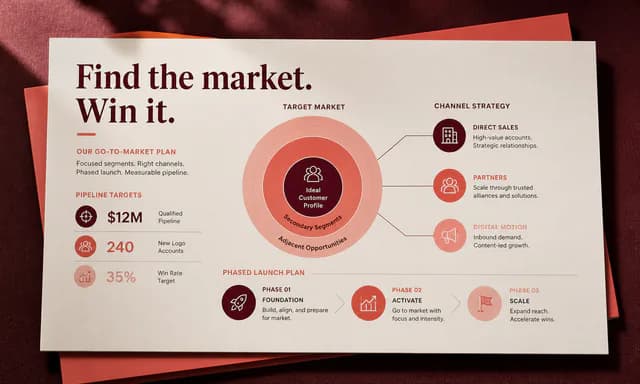
Presentation deck
Client growth strategy deck
Create a consulting-style presentation with a sharp diagnosis, growth bets, economics, roadmap, risks, and decisions.
Open template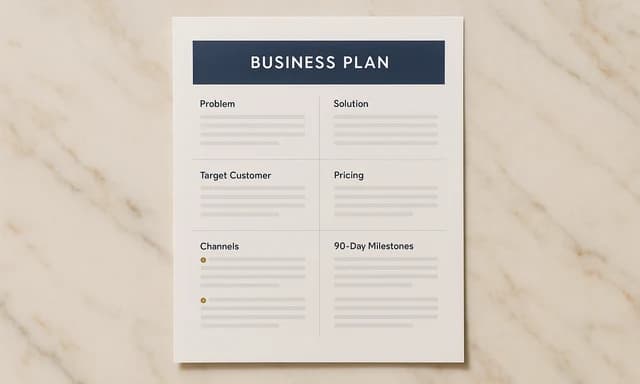
Business document
One-page business plan
Turn a raw idea into a one-page plan with problem, offer, customer, economics, and the next 90 days.
Open templateAlso explore YouTube thumbnail template for tutorials, consulting growth strategy deck template and one-page business plan template.